Notes:


Join the SolarEdge Conversation
Contact our sustainability / ESG team
Contact us
How can we help you?
Notes:
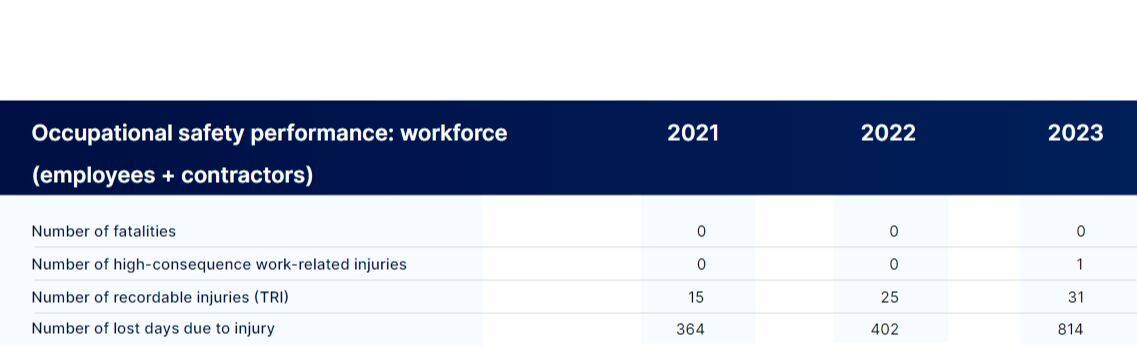
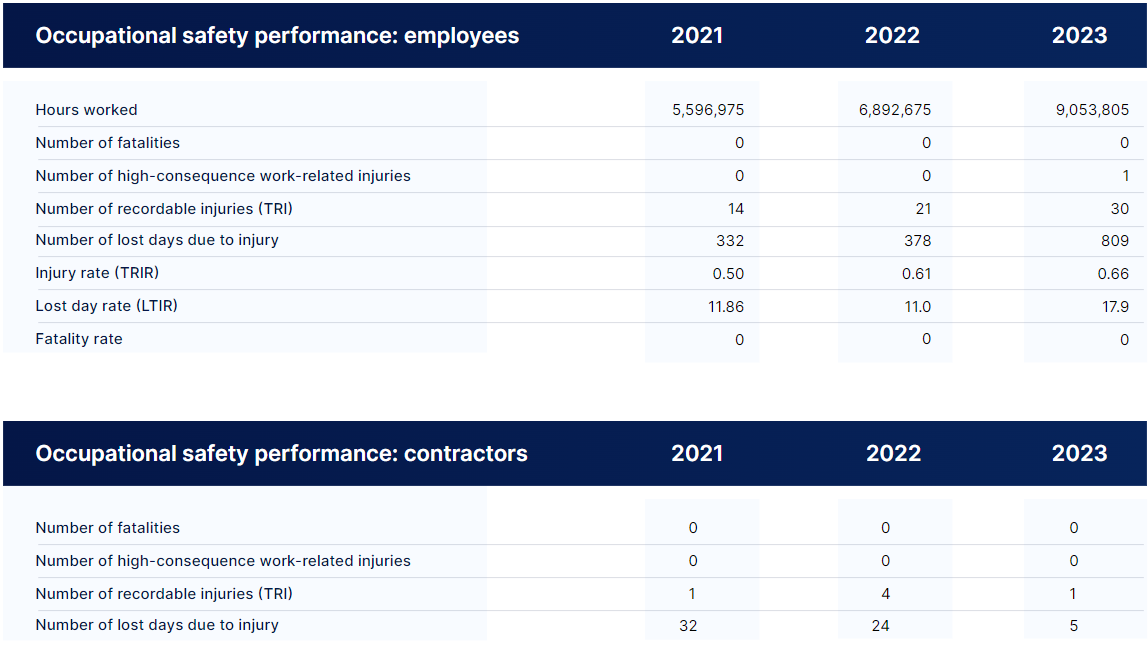
TRIR and LTIR rates are calculated using the 200,000-multiplication factor, which represents the total number of hours 100 employees would work in a year (100 workers x 40 hours x 50 weeks).
SolarEdge working hours are based on actual hours worked for all employees where available, representing the majority of the total workforce. For the remaining employees, best estimates were used, based on average hours worked in the locations measured.
Coverage includes all company employees based in all operational facilities and marketing and sales offices around the world. Contractor employee incidents are tracked and reported for the same global boundaries. The reported safety incidents include all on-site incidents and job-related traffic incidents.
TRIR and LTIR rates exclude contractor employees and include only company employees, due to data limitations regarding the work hours of our contractor employees. Nevertheless, we monitor and report all safety incidents related to our contractor employees, provide them with needed safety training and equipment, and act to prevent any risk to their personal health and safety.
See section: Health & Safety for an explanation on the increase in TRIR and LTIR rate in 2023, compared with 2022.
15
0
0
364
2022
31
0
1
814
25
0
0
402
Number of recordable injuries (TRI)
Number of fatalities
Number of high-consequence work-related injuries
Number of lost days due to injury
2023
2021
Occupational safety performance: workforce (employees + contractors)
1
0
0
32
2022
1
0
0
5
4
0
0
24
Number of recordable injuries (TRI)
Number of fatalities
Number of high-consequence work-related injuries
Number of lost days due to injury
2023
2021
Occupational safety performance: contractors
0
14
0.50
0
11.86
0
332
5,596,975
2022
0
30
0.66
0
17.9
1
809
9,053,805
0
21
0.61
0
11.0
0
378
6,892,675
Fatality rate
Number of recordable injuries (TRI)
Injury rate (TRIR)
Number of fatalities
Lost day rate (LTIR)
Number of high-consequence work-related injuries
Number of lost days due to injury
Hours worked
2023
2021
Occupational safety performance: employees
GRI 403-9: Work-related injuries
99
194,217
168,049
5,496
800
18,048
1,824
2022
169
502,837
329,150
7,643
6,805
23,292
135,948
124
385,703
268,660
8,270
4,442
24,033
80,298
GJ / $ million revenues
GJ
GJ
GJ
GJ
GJ
GJ
Energy intensity
Total energy consumption
Electricity purchased from Grid
Diesel
Solar PV generated
Gasoline
Natural Gas
2023
2021
Units
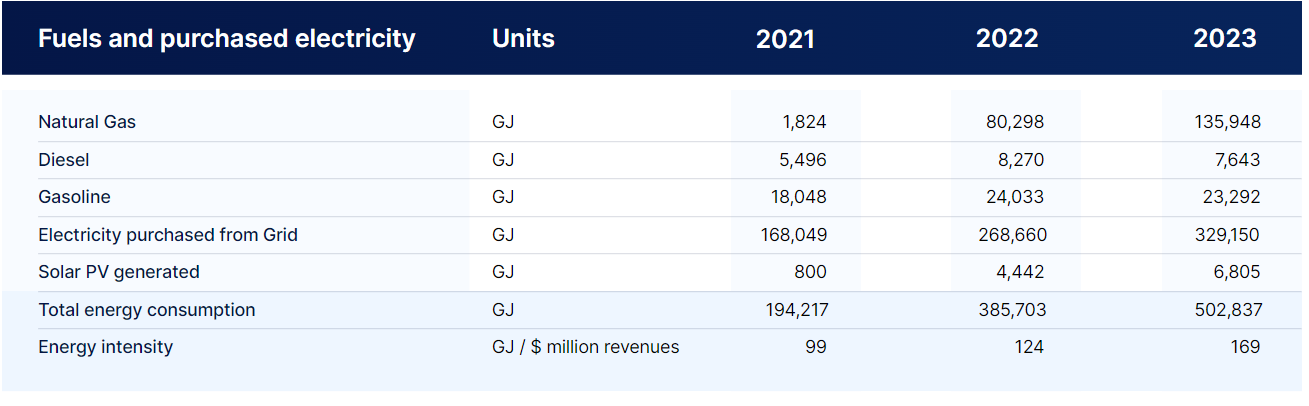
Fuels and purchased electricity
GRI 302-1: Energy consumption within the organization
GRI 302-3: Energy intensity
Note:
0.1
-
-
MT
NMHCs (Non-Methane Hydrocarbons)
1.1
-
-
MT
PM (Particulate Matter)
2.6
-
-
MT
VOCs (Volatile Organic Compounds)
1.6
0.7
-
MT
NOx (Nitrous oxide emissions)
2023
2022
2021
Units
Emissions
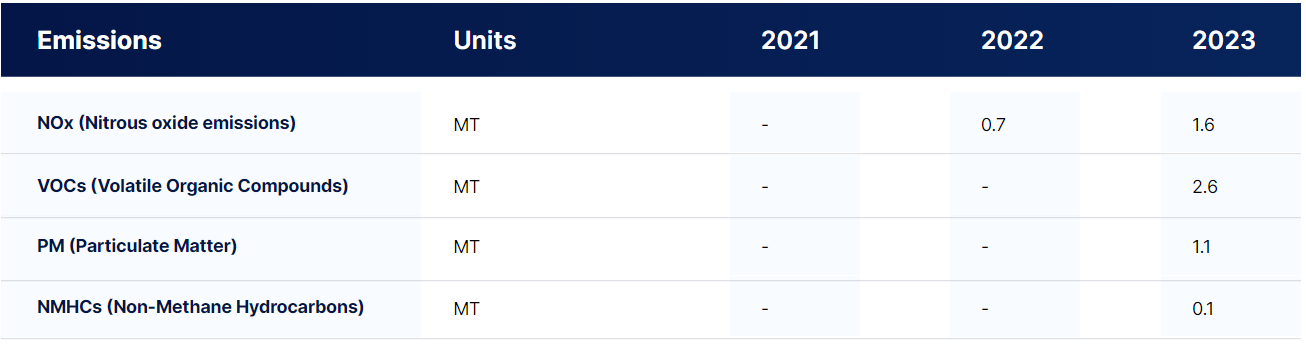
GRI 305-7: Nitrogen oxides (NOx), sulfur oxides (SOx), and other significant air emissions
The NOx emissions reported above are relevant only from 2022 with our newly opened Sella 2 site in South Korea. VOCs, PM and NMHC emissions were measured and reported from 2023 and onwards. The above reported emissions are measured and reported in accordance with local regulations and relevant for the manufacturing sites we own in Israel, South Korea and Italy. Emissions that do not require monitoring by local regulations (for example: SOx and HAP) are not measured and are considered negligible.
Due to the minor measured amounts of the emissions reported above, we do not consider these air emissions to hold a material environmental impact in relation to our activities. For that reason, we have not set reduction targets for these emissions.
Note:
21,147
26,262
18,133
MT CO2e
Contract manufacturer emissions
(Category 1: Purchased Goods and Services)
2023
2022
2021
Units
Scope 3 emissions
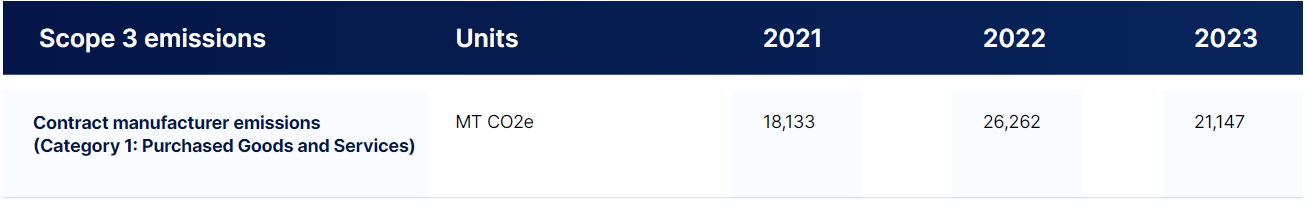
GRI 305-3: Other indirect (Scope 3) GHG emissions
The Scope 3 emissions reported above only relate to the electricity used by our contract manufacturers for producing SolarEdge products. These emissions form a part (but not all) of our Category 1 Purchased Goods and Services. We aim to expand our Scope 3 inventory going forward.
Scope 3 emissions decreased in 2023, despite the overall increase in production experienced that same year. The emission decrease was achieved by the recent insertion of renewable energy certificates, representing the majority of the annual electricity consumption at one of our contract manufacturer sites in China.
Note:
71%
59%
1,245
1,815
570
2022
2023
2021
Units
2022
2023
2021
Units
2022
749
641
108
0
108
0
423
0
218
0
1,129
967
162
101
162
0
529
0
337
0
819
1,066
604
462
554
1,470
50
386
0
0
3,593
2,138
1,456
174
1,456
1,964
0
0
0
MT
Other recovery operations
0
0
0
2,033
691
1,647
128
386
83%
88%
%
Percentage waste diverted and recovered
76%
3,104
4,722
1,618
71%
0
177
128
386
2,338
0
228
0
0
2,852
463
0
0
0
514
0
MT
MT
MT
MT
MT
MT
%
MT
MT
MT
MT
MT
MT
MT
MT
MT
MT
MT
MT
MT
MT
MT
MT
Total waste directed to disposal
Total waste diverted from disposal
Percentage waste diverted from disposal
Non-hazardous waste
Total waste generated
Total
Total
Total
Total
Other
Landfill
Recycling (Non-Electronic Waste)
Other
Other recovery operations
Incineration without energy recovery
Recycling (Electronic Waste)
Landfill
Recycling
Non-hazardous waste
Non-hazardous waste
Hazardous
waste
Hazardous
waste
Incineration with energy recovery
Preparation for reuse
Incineration with energy recovery
Preparation for reuse
Hazardous waste
2023
2021
Units
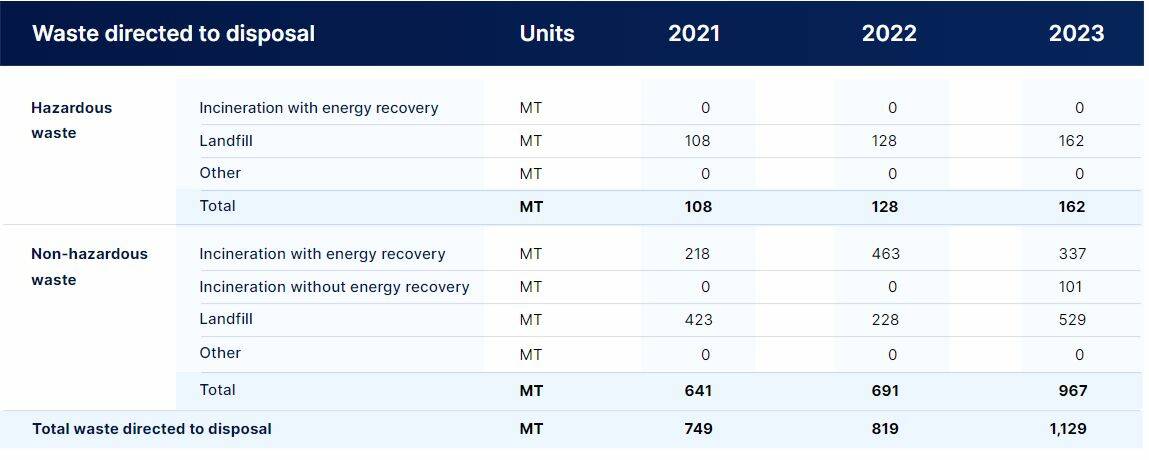
Waste directed to disposal
Waste diverted from disposal
Waste generated
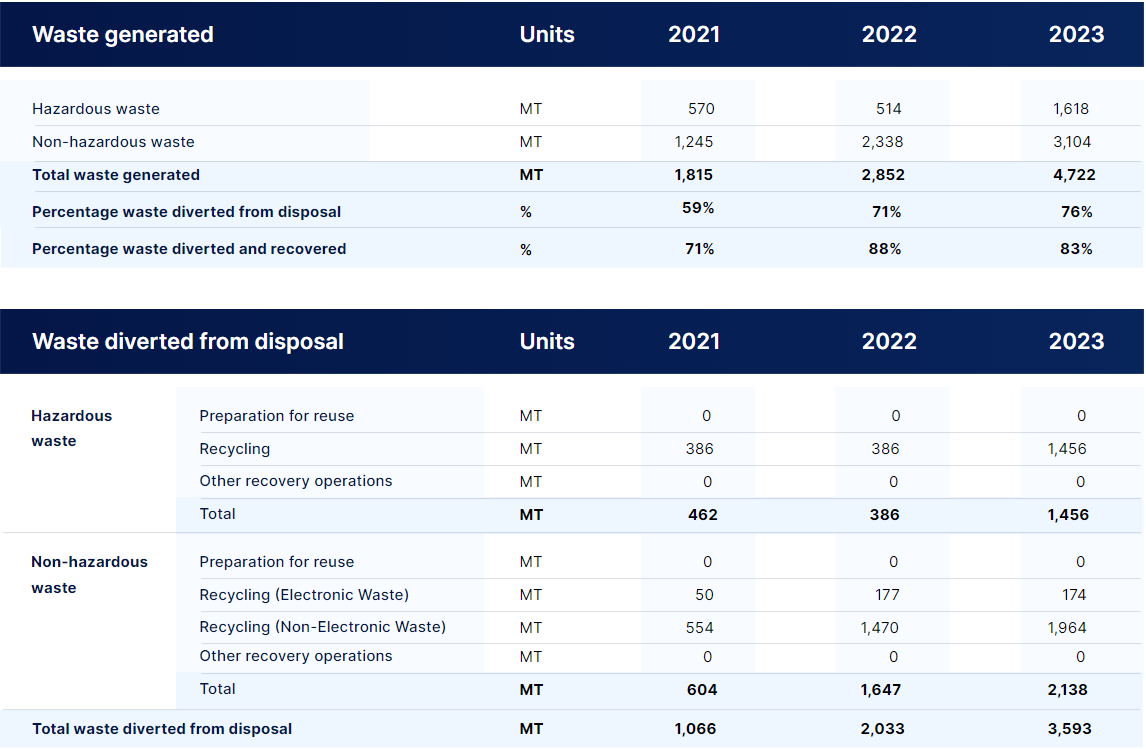
GRI 306-3: Waste generated
GRI 306-4: Waste diverted from disposal
GRI 306-5: Waste directed to disposal
Hazardous waste quantities have increased in 2023 due to increased production and a revised method of waste measurement at the Sella 2 site in Korea.
We have recorded an increase of non-hazardous waste in 2022 due to electronic and battery waste at several of our global sites as a result of activity growth during 2022. The output of non-hazardous waste at our Israeli sites increased in 2023, as a result of a parallel increase in the number of employees at those sites. An increase in non-hazardous cardboard, paper and wood waste was attributed to increased production at our Sella 1 site during 2023.
The grand majority of increased production waste in 2022 and 2023 was treated by recycling or by incineration with energy recovery. This caused a parallel increase in the rate by which we diverted waste from landfills to recycling or energy recovery.
Note:
349,688
286,249
222,624
m3
Water withdrawal – contract manufacturers
2023
2022
2021
Units
Water withdrawal -
contract manufacturers for SolarEdge production
6,159
3,150
6,229
m3
Water recycled/reused on site
13.4
10.2
30,492
37.27
80,461
110,953
8.1
m3 / $ million revenues
Water consumption intensity
26,242
20.10
13,225
39,467
2022
25,042
20.10
37,469
62,511
m3
m3/$ million revenues
m3
m3
Water consumption
Water withdrawal intensity
Water discharge
Water withdrawal
2023
2021
Units
Water withdrawal
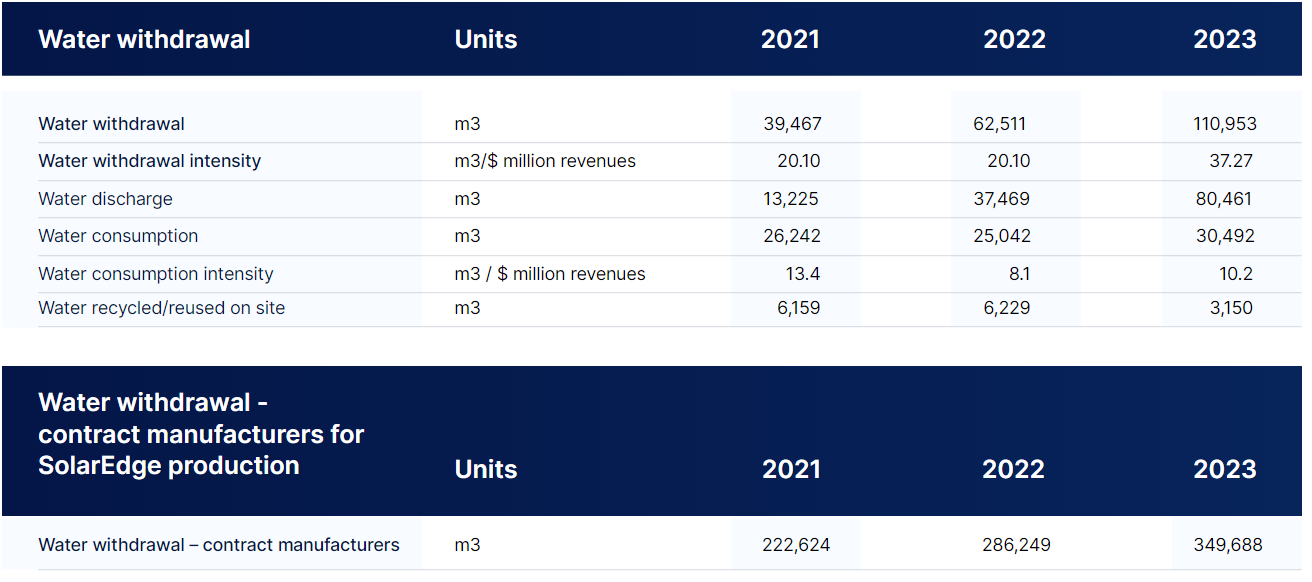
GRI 303-3: Water withdrawal
GRI 303-4: Water discharge
GRI 303-5: Water consumption
Over 99% of water used at SolarEdge operated sites is withdrawn from municipal water supplies. The remaining <1% is constituted of bottled water consumed at one of our sites.
The discharge of sanitary and kitchen water from our office locations is not currently measured and is therefore excluded from the water discharge figure above.
Water consumption in the table above is calculated by subtracting the annual water discharge from the water withdrawal and excludes internally recycled water.
Water consumption reported for contract manufacturer sites, was specifically used in the production of SolarEdge products. Data on water consumption from our newest site, opened in late 2023 in Austin, Texas, is excluded from the above reporting. We are currently working with our contract manufacturer to complete water consumption measurements from this site, specific to SolarEdge related production, in order to include that data in future reports.
The increase in water withdrawal during 2022 and 2023, and the related increase in water discharge are attributed to the Sella 2 site in Korea that was opened in May 2022, as it increased its level of production throughout 2023.
The vast majority of the water discharged by SolarEdge is attributed to the production at our Sella 2 site. Here, water is mainly used in cooling processes and has no contact with the site’s chemical process. There is a minor amount of anti-corrosion material added to the water. This cooling water is discharged to a local wastewater treatment facility, which discharges the same water to the local river post-treatment. Since the same amount of water is returned to the source river with negligible effects on water quality, we consider Sella 2 water usage to have minor environmental impact. Due to the minimal environmental impact of the wastewater reported above, we do not consider water pollutants in wastewater as material in relation to our activities. For that reason, we have not set reduction targets.
For the sake of disclosure in this report, the terms ‘water recycling’ and ‘water reusage’ are used interchangeably. See the ‘Water efficiency’ section for details on how water is being recycled/reused at our Sella 1 and Sella 2 sites.
Note:
2021
13.39
24,583
26,293
1,710
2022
17.74
42,928
52,822
9,895
13.53
35,085
42,086
7,001
MT CO2e/$ million revenues
MT CO2e
MT CO2e
MT CO2e
Emissions intensity (Scope 1+2)
Energy indirect (Scope 2) GHG emissions
Total Scope 1+2 emissions
Direct (Scope 1) GHG emissions
2023
Units
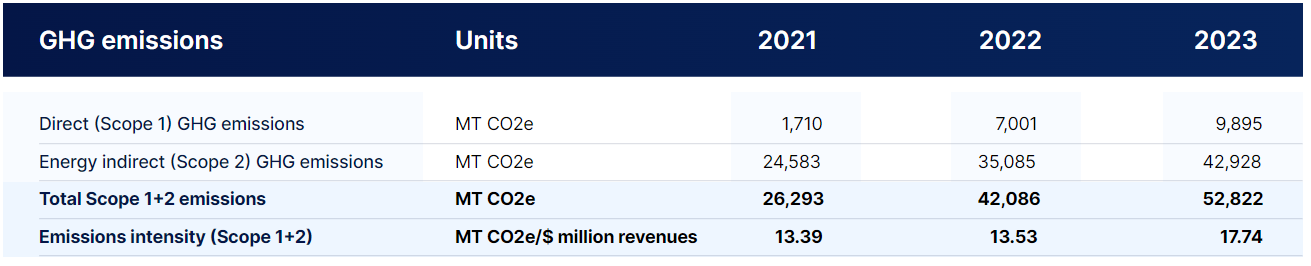
GHG emissions
GRI 305-1: Direct (Scope 1) GHG emissions
GRI 305-2: Energy indirect (Scope 2) GHG emissions
GRI 305-4: GHG emissions intensity
GHG emissions use IEA 2021 and AIB European Residual Mix 2022 conversion factors, except for Israel (IEC- Israel Electric Corporation, 2022), U.S. (eGrid 2022 factors for subregions WECC California, WECC Northwest, and ERCT All) and supplier specific factors when available.
GHG gas emissions include carbon dioxide (CO2), methane (CH4) and nitrous oxide (N2O).
Refrigerant gas (HFC)emissions are only included in our sustainability report from 2022 and onwards, as data was not previously available. However, these emissions formed only 0.3% (26 MT CO2e) of the total Scope 1 emissions in 2023, with almost all (99.7%) of Scope 1 emissions still related to fuel consumption.
Scope 2 emissions are reported using a market-based method. Solar PV generated power is reported with zero related emissions.
The 2022 and 2023 increases in electricity and natural gas consumption, and the related increase in Scope 1 and 2 emissions, are attributed to the Sella 2 site in Korea that initiated operations in May 2022 and has increased production during 2023.
GRI 412-3 Significant investment agreements and contracts that include human rights clauses or that underwent human rights screening
Our Supplier Code of Conduct includes detailed requirements regarding various ESG fields, including ethics, environmental protection, safety, responsible upstream sourcing, and the protection of human rights. To date, more than 230 active suppliers have signed their acknowledgment of our Supplier Code of Conduct or presented equivalent codes of their own.; Seven of these active supplier sites (including 4 of our contract manufacturer sites) have undergone related on-site audits. To date, we have not found evidence indicating that further screening of suppliers based on human rights risk is required.
GRI 403-10: Work-related ill health
Occupational Safety Risk Assessments have not resulted in identification of specific occupational ill-health topics. We continue to monitor this as part of our ongoing safety programs and audits.
GRI 403-8 Workers covered by an occupational health and
safety management system
GRI 403-7: Occupational health and safety impacts linked
by business relationships
GRI 403-6: Promotion of worker health
We aim to certify all current and future manufacturing and R&D sites under our operational control to relevant ISO standards for management systems in the fields of quality, environment, and safety.
Currently, 100% of the designated sites (where 67% of our total global employees work), have been certified to ISO 45001 (safety management).
We work to ensure that our suppliers understand and agree to adhere to our Supplier Code of Conduct. We have already received acceptance of our Supplier Code of Conduct from hundreds of our active suppliers and all our contract manufacturing sites (see section: Responsible Procurement). The Code of Conduct explicitly references “Protection of Workers” and the maintenance of occupational health and safety provisions.
We encourage employees to maintain good health and support their efforts with a range of recreational activities that help improve physical energy and reduce stress, as well as healthcare benefits. See section: Health & Safety.
GRI 403-1: Occupational health and safety management system
GRI 403-2: Hazard identification, risk assessment, and incident investigation
GRI 403-3: Occupational health services
GRI 403-4: Worker consultation on occupational health and safety
GRI 403-5: Worker training on occupational health and safety
SolarEdge takes a proactive approach in assuring the occupational health and safety of its employees, ensuring that we are compliant with laws and regulations while striving for safety excellence. All our global manufacturing and R&D operations are certified to ISO Occupational Health and Safety Quality Management Standard ISO 45001:2018. We conduct regular risk assessments and incident investigation in line with ISO requirements. In all of our manufacturing and R&D sites, employees participate in safety activities and in defining safety programs, requirements and measures. Annual safety training is mandatory for all employees and specialized safety training is conducted for those in relevant or high-safety-risk roles. Only a minority of SolarEdge sites provide occupational health services onsite. However, in the event of a safety incident or need for medical consultation, Safety Officers in place at all sites are trained to provide the appropriate responses to ensure needed medical attention is provided.
GRI 102-41 Collective bargaining agreements
285 employees based in Italy and Japan are employed through collective bargaining agreements, representing 5% of our total global company workforce. The remaining (95%) of our employees are employed with individual contracts.
Environmental contribution, mitigation of negative impacts, remediation, engagement and dialogue on environmental matters.
Safeguarding the environment and ecological impacts in communities. Supporting communities in improving lives. Local hiring. Local economic contribution.
Return on investment, reliable financial and production forecasts, strong governance and responsible and ethical conduct. Transparent disclosure.
Compliance, transparency, collaboration to resolve regulatory issues in ways that benefit national and local interests. Compliance with climate change initiatives. Transparent disclosure.
Fair dealing, opportunity to compete (especially diversity or minority suppliers), opportunity to engage in new developments.
Product quality, fast and reliable service, improved carbon footprint, reliability, responsiveness to needs, competitive pricing.
Meaningful work, fair compensation, ability to learn and develop, fair and ethical treatment. A company that they can be proud to work for. Competent leadership. Safe and empowering work culture.
Targeted engagement on specific topics, conferences, industry events
Community events, volunteering in communities
Annual meetings, dialogue with investors and research analysts
As needed to support current and emerging regulatory requirements
Periodical meetings and discussions
Meetings, customer service surveys, professional training events
A range of internal communications channels throughout the year
Environmental organizations
Communities
Investors/ Stockholders
Regulators
Suppliers
Customers
Employees
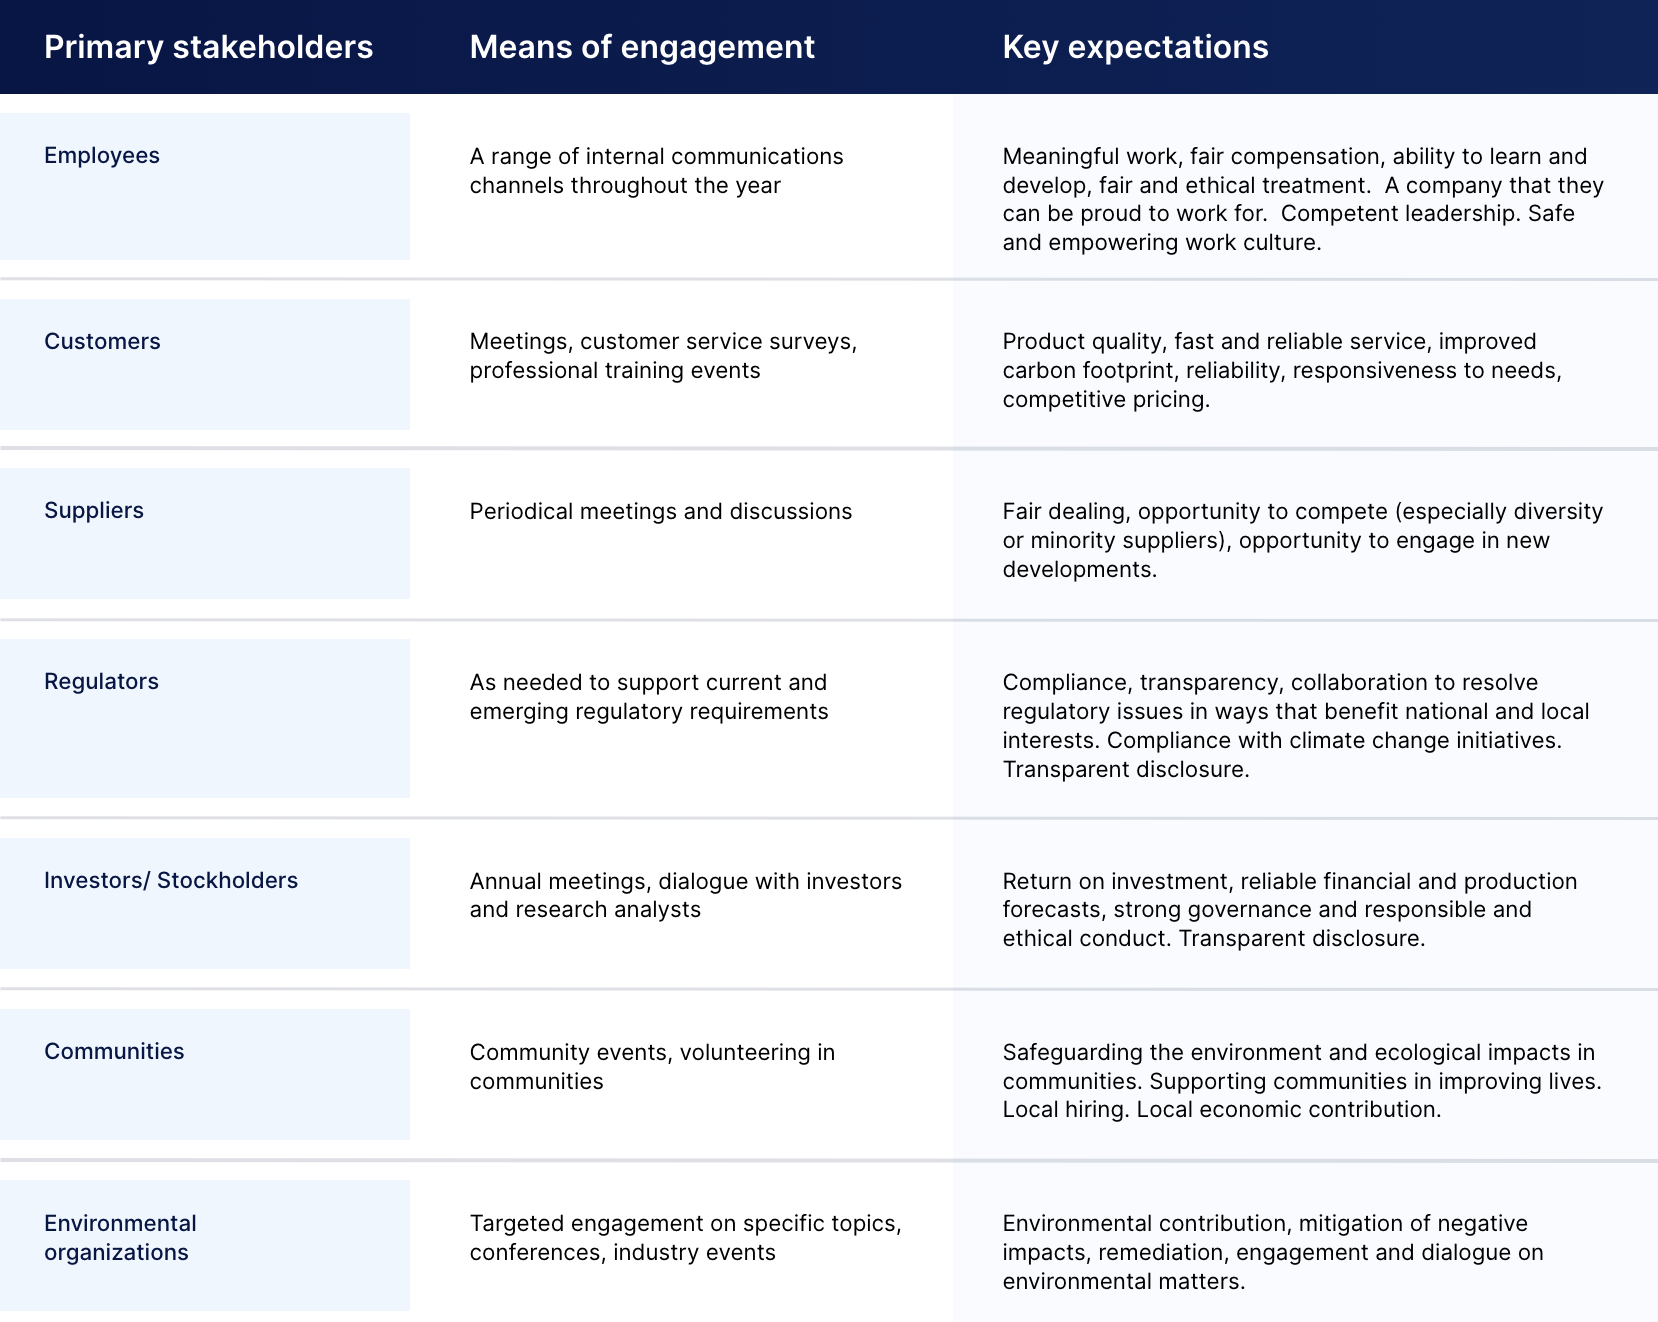
Key expectations
Means of engagement
Primary stakeholders
GRI 102-40 List of stakeholder groups
GRI 102-42 Identifying and selecting stakeholders
GRI 102-43 Stakeholder engagement
GRI 102-44 Key topics and concerns raised
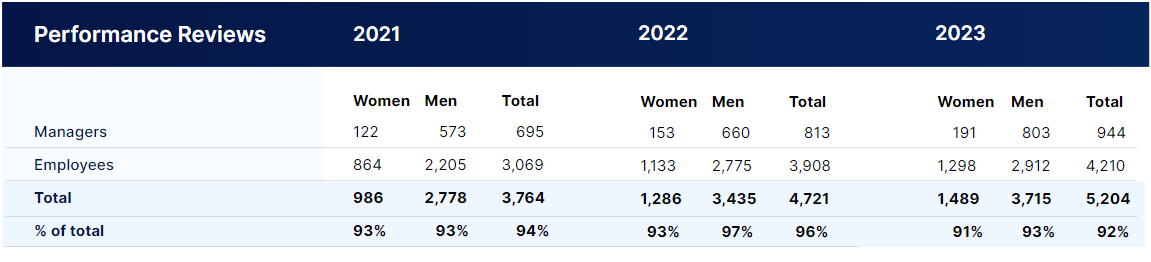
GRI 404-3: Performance reviews
2023
93%
92%
91%
2,912
4,210
1,298
Men
3,715
Total
5,204
Women
1,489
803
944
191
2022
97%
96%
93%
2,775
3,908
1,133
Men
3,435
Total
4,721
Women
1,286
660
813
153
93%
94%
93%
2,205
3,069
864
Men
2,778
Total
3,764
Women
986
573
695
122
% of total
Employees
Total
Managers
2021
Performance Reviews
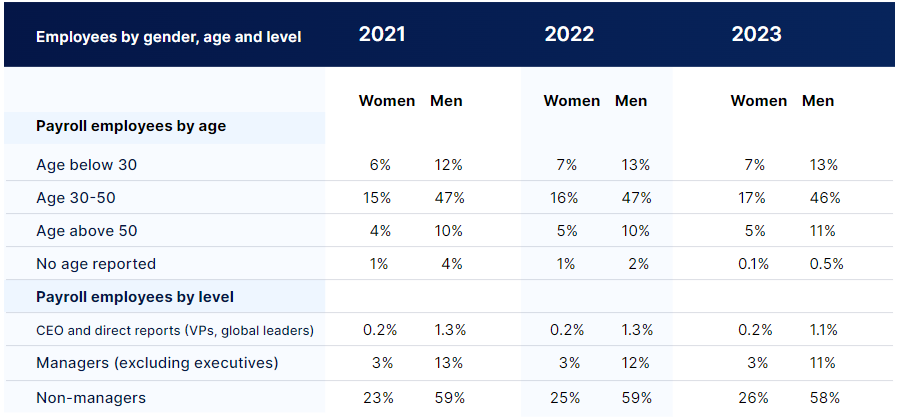
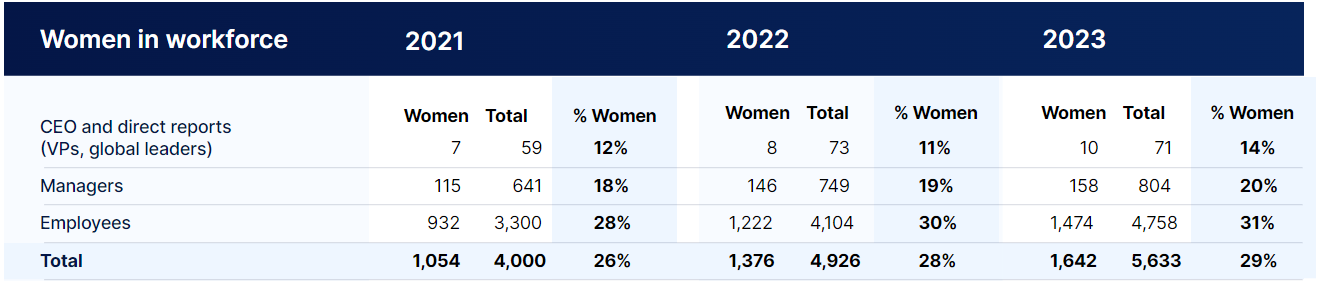
GRI 405-1: Diversity of governance bodies and employees
As of April 2024, SolarEdge’s Board of Directors includes three women, which represents 38% of our eight-person Board of Directors.
59%
13%
4%
23%
3%
1%
47%
15%
Men
1.3%
10%
Women
0.2%
4%
12%
6%
2022
58%
11%
0.5%
26%
3%
0.1%
46%
17%
1.1%
11%
0.2%
5%
13%
7%
59%
12%
2%
25%
3%
1%
47%
16%
Men
Men
1.3%
10%
Women
Women
Payroll employees by age
0.2%
5%
13%
7%
Non-managers
Managers (excluding executives)
No age reported
Age 30-50
Payroll employees by level
CEO and direct reports (VPs, global leaders)
Age above 50
Age below 30
2021
2023
Employees by gender, age and level
Notes:
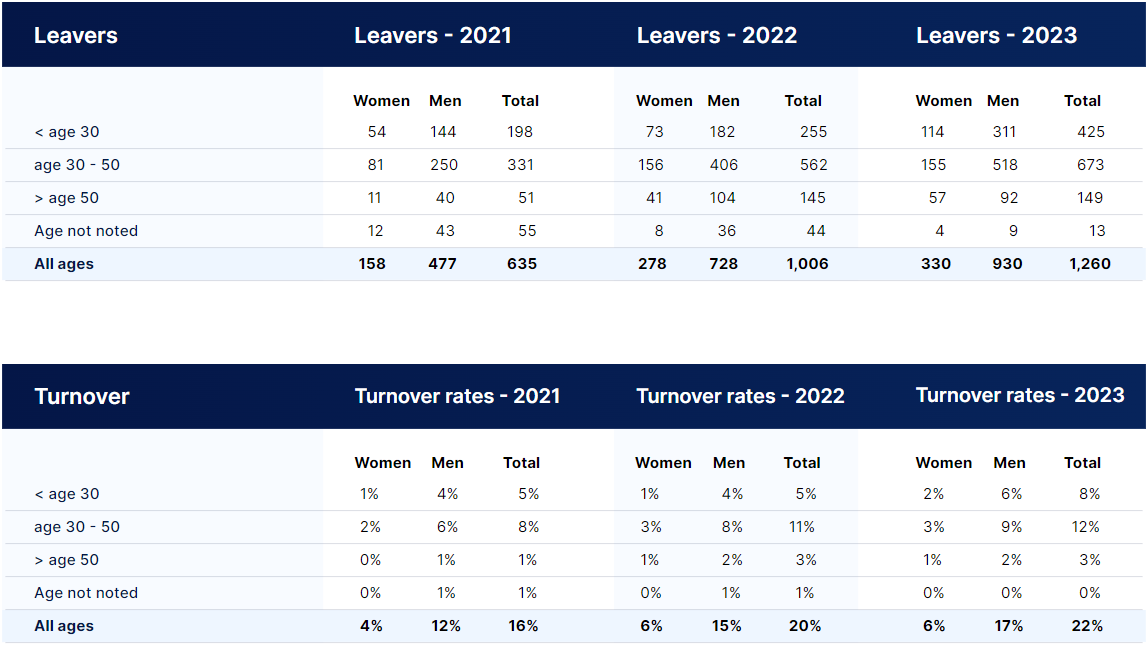
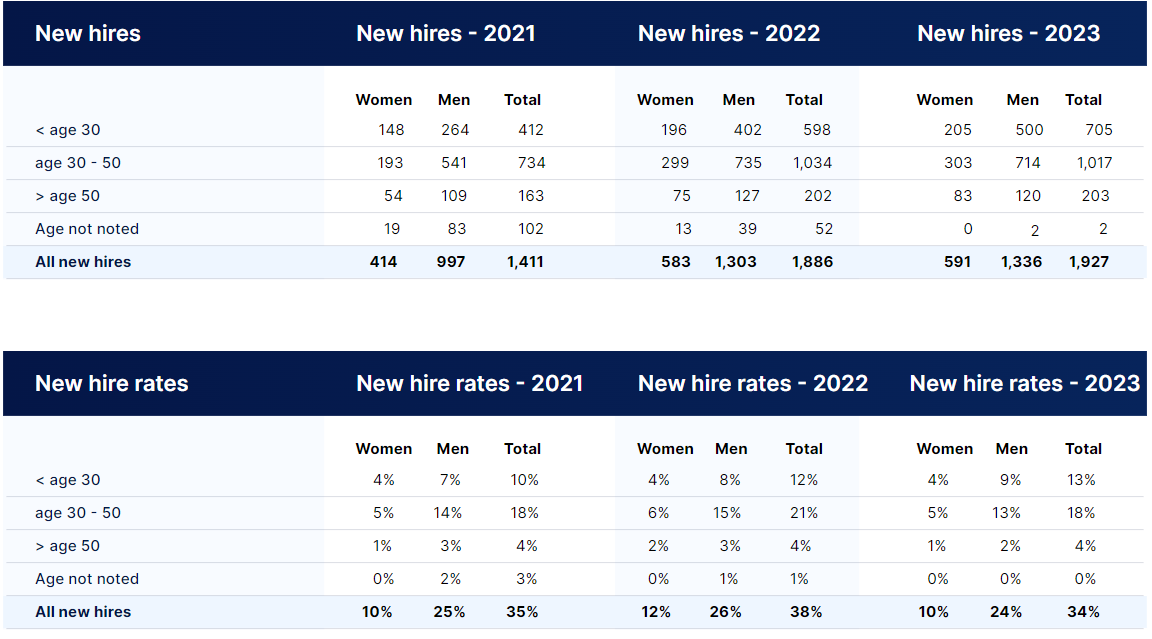
New hire and turnover rates are calculated by dividing the number of new hires/leavers with the total employees at each year's end.
Note:
Figures regarding contingent staff include manufacturing workers in Israel and Italy, and some external consultants employed on a full-time basis in various countries.
Note:
Data represents headcount at year end
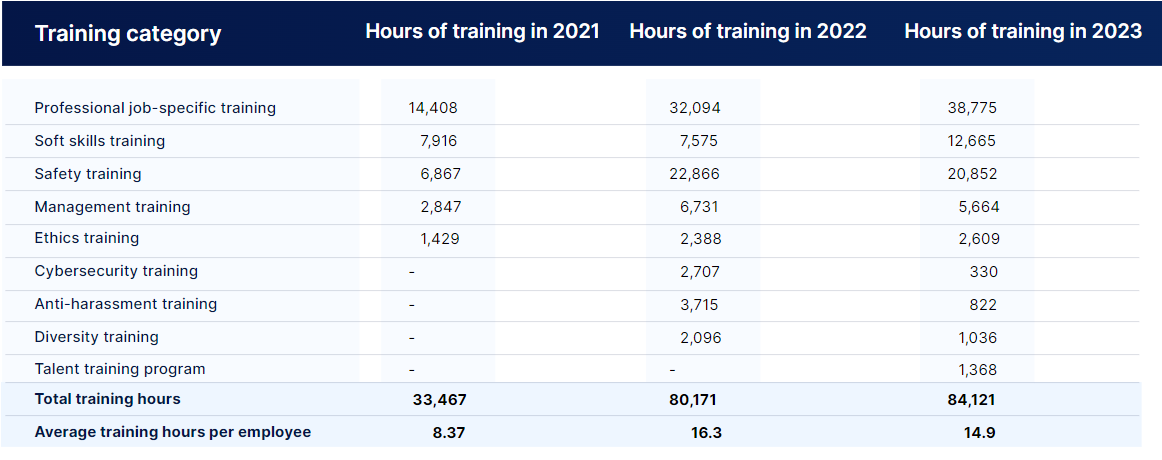
Training applies to all SolarEdge employees globally. Training data distribution by gender and employee category are not available at this time.
GRI 404-1: Training
5,664
12,665
20,852
822
330
2,609
38,775
84,121
14.9
1,368
-
-
Talent training program
1,036
Hours of training in 2023
6,731
7,575
22,866
3,715
2,707
2,388
32,094
2,847
80,171
16.3
2,096
Hours of training in 2022
33,467
7,916
8.37
6,867
-
Diversity training
-
Anti-harassment training
-
Cybersecurity training
1,429
14,408
Management training
Total training hours
Soft skills training
Average training hours per employee
Safety training
Ethics training
Professional job-specific training
Hours of training in 2021
Training category
GRI 401-1: New employee hires and turnover rates
2%
3%
0%
14%
18%
5%
25%
35%
10%
Men
3%
Total
4%
Women
1%
7%
10%
4%
New hire rates - 2022
0%
0%
0%
13%
18%
5%
24%
34%
10%
2%
4%
1%
9%
13%
4%
1%
1%
0%
15%
21%
6%
26%
38%
12%
Men
Men
3%
Total
Total
4%
Women
Women
2%
8%
12%
4%
Age not noted
age 30 - 50
All new hires
> age 50
< age 30
New hire rates - 2021
New hire rates - 2023
New hire rates
Men
Total
Women
Turnover rates - 2021
1%
1%
0%
6%
8%
2%
12%
16%
4%
Men
1%
Total
1%
Women
0%
4%
5%
1%
Turnover rates - 2022
0%
0%
0%
9%
12%
3%
17%
22%
6%
2%
3%
1%
6%
8%
2%
1%
1%
0%
8%
11%
3%
15%
20%
6%
Men
2%
Total
3%
Women
1%
4%
5%
1%
Age not noted
age 30 - 50
All ages
> age 50
< age 30
Turnover rates - 2023
Turnover
Men
Total
Women
Leavers - 2021
43
55
12
250
331
81
477
635
158
Men
40
Total
51
Women
11
144
198
54
Leavers - 2022
9
13
4
518
673
155
930
1,260
330
92
149
57
311
425
114
36
44
8
406
562
156
728
1,006
278
Men
104
Total
145
Women
41
182
255
73
Age not noted
age 30 - 50
All ages
> age 50
< age 30
Leavers - 2023
Leavers
Men
Total
Women
New hires - 2021
83
102
19
541
734
193
997
1,411
414
Men
109
Total
163
Women
54
264
412
148
New hires - 2022
2
2
0
714
1,017
303
1,336
1,927
591
120
203
83
500
705
205
39
52
13
735
1,034
299
1,303
1,886
583
Men
127
Total
202
Women
75
402
598
196
Age not noted
age 30 - 50
All new hires
> age 50
< age 30
New hires - 2023
New hires
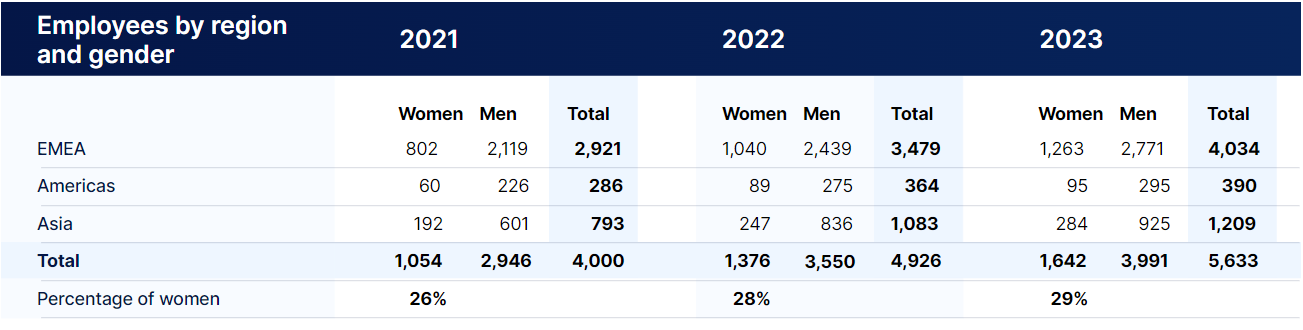
GRI 102-8 Information on employees
4,000
26%
1,054
641
18%
115
Total
3,300
% Women
28%
Women
932
59
12%
7
2022
5,633
29%
1,642
804
20%
158
4,758
31%
1,474
71
14%
10
4,926
28%
1,376
749
19%
146
Total
Total
4,104
% Women
% Women
30%
Women
Women
1,222
73
11%
8
Total
Managers
Employees
CEO and direct reports (VPs, global leaders)
2021
2023
Women in workforce
2,946
4,000
1,054
226
286
60
26%
Men
601
Total
793
Women
192
2,119
2,921
802
2022
Employees by region and gender
3,991
5,633
1,642
295
390
95
29%
925
1,209
284
2,771
4,034
1,263
3,550
4,926
1,376
275
364
89
28%
Men
Men
836
Total
Total
1,083
Women
Women
247
2,439
3,479
1,040
Total
Americas
Percentage of women
Asia
EMEA
2021
2023
Men
Total
Women
2021
2,959
4,000
1,041
171
269
98
21
35
14
3,117
4,269
1,152
Men
2,946
Total
4,000
Women
1,054
2,925
3,965
1,040
2022
3,939
5,549
1,610
384
479
95
48
86
38
4,375
6,112
1,737
3,991
5,633
1,642
3,943
5,547
1,604
3,530
4,893
1,363
253
368
115
35
62
27
3,803
5,294
1,491
Men
3,550
Total
4,926
Women
1,376
3,515
4,864
1,349
Employees on permanent contracts
Contingent workers
Direct employees part time
Total workforce
Total direct employees
Direct employees full time
2023
Employees by contract
Sustainability Report 2023 /
GRI Data Tables
New hire and turnover rates are calculated by dividing the number of new hires/leavers with the total employees at each year's end.
Notes:
Note: Figures regarding contingent staff include manufacturing workers in Israel and Italy, and some external consultants employed on a full-time basis in various countries.
*Slide tables to the left to see entire tables
GRI 405-1: Diversity of governance bodies and employees
GRI 404-3: Performance reviews
GRI 404-1: Training
GRI 401-1: New employee hires and turnover rates
GRI 403-10: Work-related ill health
Occupational Safety Risk Assessments have not resulted in identification of specific occupational ill-health topics. We continue to monitor this as part of our ongoing safety programs and audits.
GRI 403-9: Work-related injuries
GRI 403-8 Workers covered by an occupational health and
safety management system
GRI 403-7: Occupational health and safety impacts linked
by business relationships
GRI 403-6: Promotion of worker health
We aim to certify all current and future manufacturing and R&D sites under our operational control to relevant ISO standards for management systems in the fields of quality, environment, and safety.
Currently, 100% of the designated sites (where 67% of our total global employees work), have been certified to ISO 45001 (safety management).
We work to ensure that our suppliers understand and agree to adhere to our Supplier Code of Conduct. We have already received acceptance of our Supplier Code of Conduct from hundreds of our active suppliers and all our contract manufacturing sites (see section: Responsible Procurement). The Code of Conduct explicitly references “Protection of Workers” and the maintenance of occupational health and safety provisions.
We encourage employees to maintain good health and support their efforts with a range of recreational activities that help improve physical energy and reduce stress, as well as healthcare benefits. See section: Health & Safety.
SolarEdge takes a proactive approach in assuring the occupational health and safety of its employees, ensuring that we are compliant with laws and regulations while striving for safety excellence. All our global manufacturing and R&D operations are certified to ISO Occupational Health and Safety Quality Management Standard ISO 45001:2018. We conduct regular risk assessments and incident investigation in line with ISO requirements. In all of our manufacturing and R&D sites, employees participate in safety activities and in defining safety programs, requirements and measures. Annual safety training is mandatory for all employees and specialized safety training is conducted for those in relevant or high-safety-risk roles. Only a minority of SolarEdge sites provide occupational health services onsite. However, in the event of a safety incident or need for medical consultation, Safety Officers in place at all sites are trained to provide the appropriate responses to ensure needed medical attention is provided.
GRI 403-1: Occupational health and safety management system
GRI 403-2: Hazard identification, risk assessment, and incident investigation
GRI 403-3: Occupational health services
GRI 403-4: Worker consultation on occupational health and safety
GRI 403-5: Worker training on occupational health and safety
GRI 303-3: Water withdrawal
GRI 303-4: Water discharge
GRI 303-5: Water consumption
The NOx emissions reported above are relevant only from 2022 with our newly opened Sella 2 site in South Korea. VOCs, PM and NMHC emissions were measured and reported from 2023 and onwards. The above reported emissions are measured and reported in accordance with local regulations and relevant for the manufacturing sites we own in Israel, South Korea and Italy. Emissions that do not require monitoring by local regulations (for example: SOx and HAP) are not measured and are considered negligible.
Due to the minor measured amounts of the emissions reported above, we do not consider these air emissions to hold a material environmental impact in relation to our activities. For that reason, we have not set reduction targets for these emissions.
Note:
GRI 305-7: Nitrogen oxides (NOx), sulfur oxides (SOx), and other significant air emissions
The Scope 3 emissions reported above only relate to the electricity used by our contract manufacturers for producing SolarEdge products. These emissions form a part (but not all) of our Category 1 Purchased Goods and Services. We aim to expand our Scope 3 inventory going forward.
Scope 3 emissions decreased in 2023, despite the overall increase in production experienced that same year. The emission decrease was achieved by the recent insertion of renewable energy certificates, representing the majority of the annual electricity consumption at one of our contract manufacturer sites in China.
Note:
GRI 305-3: Other indirect (Scope 3) GHG emissions
Note:
GHG emissions use IEA 2021 and AIB European Residual Mix 2022 conversion factors, except for Israel (IEC- Israel Electric Corporation, 2022), U.S. (eGrid 2022 factors for subregions WECC California, WECC Northwest, and ERCT All) and supplier specific factors when available.
GHG gas emissions include carbon dioxide (CO2), methane (CH4) and nitrous oxide (N2O).
Refrigerant gas (HFC)emissions are only included in our sustainability report from 2022 and onwards, as data was not previously available. However, these emissions formed only 0.3% (26 MT CO2e) of the total Scope 1 emissions in 2023, with almost all (99.7%) of Scope 1 emissions still related to fuel consumption.
Scope 2 emissions are reported using a market-based method. Solar PV generated power is reported with zero related emissions.
The 2022 and 2023 increases in electricity and natural gas consumption, and the related increase in Scope 1 and 2 emissions, are attributed to the Sella 2 site in Korea that initiated operations in May 2022 and has increased production during 2023.
GRI 102-41 Collective bargaining agreements
285 employees based in Italy and Japan are employed through collective bargaining agreements, representing 5% of our total global company workforce. The remaining (95%) of our employees are employed with individual contracts.
GRI 102-40 List of stakeholder groups
GRI 102-42 Identifying and selecting stakeholders
GRI 102-43 Stakeholder engagement
GRI 102-44 Key topics and concerns raised
GRI 302-1: Energy consumption within the organization
GRI 302-3: Energy intensity
GRI 305-1: Direct (Scope 1) GHG emissions
GRI 305-2: Energy indirect (Scope 2) GHG emissions
GRI 305-4: GHG emissions intensity
Note:
Over 99% of water used at SolarEdge operated sites is withdrawn from municipal water supplies. The remaining <1% is constituted of bottled water consumed at one of our sites.
The discharge of sanitary and kitchen water from our office locations is not currently measured and is therefore excluded from the water discharge figure above.
Water consumption in the table above is calculated by subtracting the annual water discharge from the water withdrawal and excludes internally recycled water.
Water consumption reported for contract manufacturer sites, was specifically used in the production of SolarEdge products. Data on water consumption from our newest site, opened in late 2023 in Austin, Texas, is excluded from the above reporting. We are currently working with our contract manufacturer to complete water consumption measurements from this site, specific to SolarEdge related production, in order to include that data in future reports.
The increase in water withdrawal during 2022 and 2023, and the related increase in water discharge are attributed to the Sella 2 site in Korea that was opened in May 2022, as it increased its level of production throughout 2023.
The vast majority of the water discharged by SolarEdge is attributed to the production at our Sella 2 site. Here, water is mainly used in cooling processes and has no contact with the site’s chemical process. There is a minor amount of anti-corrosion material added to the water. This cooling water is discharged to a local wastewater treatment facility, which discharges the same water to the local river post-treatment. Since the same amount of water is returned to the source river with negligible effects on water quality, we consider Sella 2 water usage to have minor environmental impact. Due to the minimal environmental impact of the wastewater reported above, we do not consider water pollutants in wastewater as material in relation to our activities. For that reason, we have not set reduction targets.
For the sake of disclosure in this report, the terms ‘water recycling’ and ‘water reusage’ are used interchangeably. See the ‘Water efficiency’ section for details on how water is being recycled/reused at our Sella 1 and Sella 2 sites.
GRI 306-3: Waste generated
GRI 306-4: Waste diverted from disposal
GRI 306-5: Waste directed to disposal
Hazardous waste quantities have increased in 2023 due to increased production and a revised method of waste measurement at the Sella 2 site in Korea.
We have recorded an increase of non-hazardous waste in 2022 due to electronic and battery waste at several of our global sites as a result of activity growth during 2022. The output of non-hazardous waste at our Israeli sites increased in 2023, as a result of a parallel increase in the number of employees at those sites. An increase in non-hazardous cardboard, paper and wood waste was attributed to increased production at our Sella 1 site during 2023.
The grand majority of increased production waste in 2022 and 2023 was treated by recycling or by incineration with energy recovery. This caused a parallel increase in the rate by which we diverted waste from landfills to recycling or energy recovery.
Note:
TRIR and LTIR rates are calculated using the 200,000-multiplication factor, which represents the total number of hours 100 employees would work in a year (100 workers x 40 hours x 50 weeks).
SolarEdge working hours are based on actual hours worked for all employees where available, representing the majority of the total workforce. For the remaining employees, best estimates were used, based on average hours worked in the locations measured.
Coverage includes all company employees based in all operational facilities and marketing and sales offices around the world. Contractor employee incidents are tracked and reported for the same global boundaries. The reported safety incidents include all on-site incidents and job-related traffic incidents.
TRIR and LTIR rates exclude contractor employees and include only company employees, due to data limitations regarding the work hours of our contractor employees. Nevertheless, we monitor and report all safety incidents related to our contractor employees, provide them with needed safety training and equipment, and act to prevent any risk to their personal health and safety.
See section: Health & Safety for an explanation on the increase in TRIR and LTIR rate in 2023, compared with 2022.
Notes:


Join the SolarEdge Conversation
Contact our sustainability / ESG team
Contact us
How can we help you?
Training applies to all SolarEdge employees globally. Training data distribution by gender and employee category are not available at this time.
GRI 412-3 Significant investment agreements and contracts that include human rights clauses or that underwent human rights screening
Our Supplier Code of Conduct includes detailed requirements regarding various ESG fields, including ethics, environmental protection, safety, responsible upstream sourcing, and the protection of human rights. To date, more than 230 active suppliers have signed their acknowledgment of our Supplier Code of Conduct or presented equivalent codes of their own.; Seven of these active supplier sites (including 4 of our contract manufacturer sites) have undergone related on-site audits. To date, we have not found evidence indicating that further screening of suppliers based on human rights risk is required.
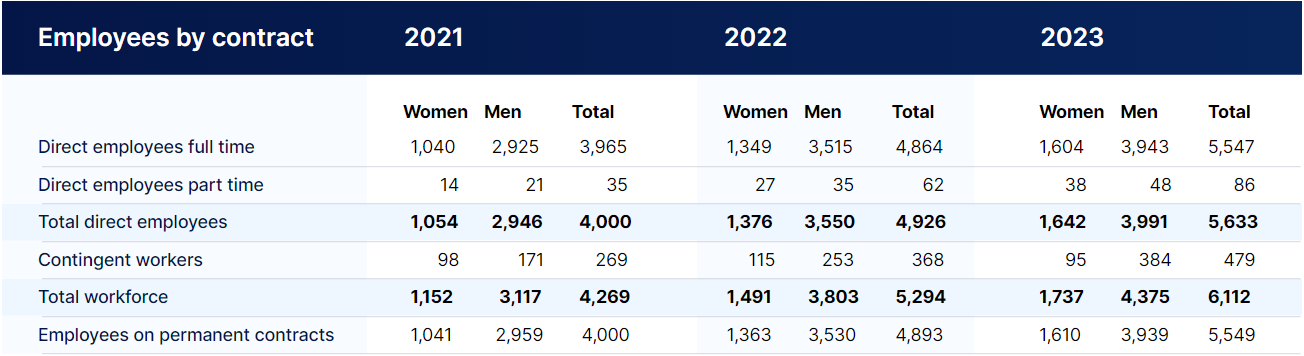
Note: Data represents headcount at year end
GRI 102-8 Information on employees
GRI Data Tables
Sustainability Report 2023 /